Resistance
Resistance is a price level where an asset’s upward movement tends to pause or reverse due to increased selling pressure, often acting as a psychological or technical “ceiling” in the market.
Detailed Explanation
In trading, resistance refers to a level where the price of an asset repeatedly struggles to move higher. At this level, selling interest increases, either from traders taking profits, short sellers entering the market, or automated systems reacting to technical signals.
Resistance levels can be identified through:
Previous highs where price reversed
Psychological round numbers (e.g., $100, $1,000)
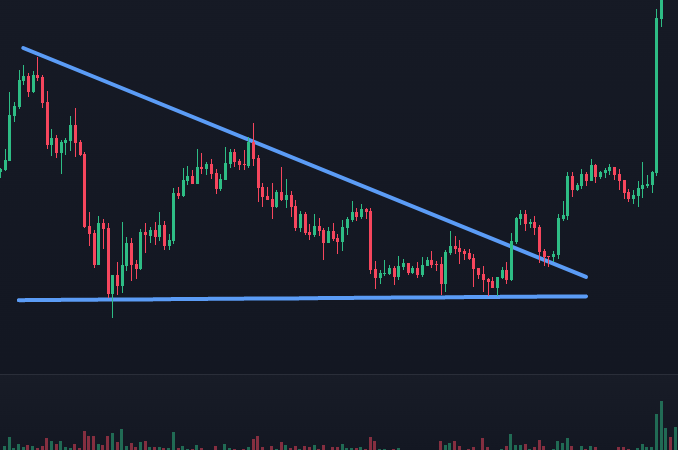
Trendlines or horizontal price zones
Technical indicators like Fibonacci retracements or moving averages
Resistance functions as an important concept in technical analysis, signaling areas where a price rally might lose momentum. If an asset approaches resistance and fails to break above it, this may indicate weakening bullish momentum.
However, if the price breaks through resistance with strong volume, it may signal a bullish breakout. In this case, the former resistance often becomes a new support level, a concept known as role reversal.
Resistance is typically not an exact price but a zone where price action slows or reverses. Its strength increases with the number of times it has been tested without breaking.
Significance for Investors
Resistance helps traders determine potential exit points, profit targets, and short entry opportunities. Knowing where a market tends to reverse upward movement allows for more strategic trade planning.
In sideways markets, resistance levels can help define a trading range. In trending markets, identifying resistance can assist in managing open trades or timing entries during retracements.
By anticipating where price advances may stall, investors can reduce the likelihood of entering trades at overextended levels and better manage risk.
Examples
The share price of Company XYZ has rallied several times to $200 over the last few months but has failed to break above it. Each time it reaches this level, selling activity increases, pushing the price lower. Traders recognize $200 as a resistance level and monitor it closely for either a rejection or breakout.
Comparison with Similar Terms
Support:
The opposite of resistance; a level where declining prices tend to pauseBreakout:
A strong price move above resistance or below support
Discover a comprehensive glossary of essential trading terms that every investor should know. Explore detailed explanations of key concepts, from basic definitions to in-depth insights
Delve into detailed explanations of the most important technical indicators used in trading. Designed for traders of all levels, our curated list will help you interpret market signals, make informed decisions, and enhance your trading skills
Access detailed explanations of key chart patterns used in technical analysis. Perfect for traders at any level, our extensive collection will help you recognize market trends, make informed decisions, and refine your trading strategie
Disclaimer
The information provided on this website is for educational and informational purposes only and should not be construed as financial advice. We do not guarantee the accuracy, completeness, or reliability of any information presented. Any actions taken based on the information found on this website are strictly at your own risk. Always seek the advice of a qualified financial professional before making any investment decisions. We disclaim any liability for any losses or damages incurred as a result of using this website.