Moving Average (MA)
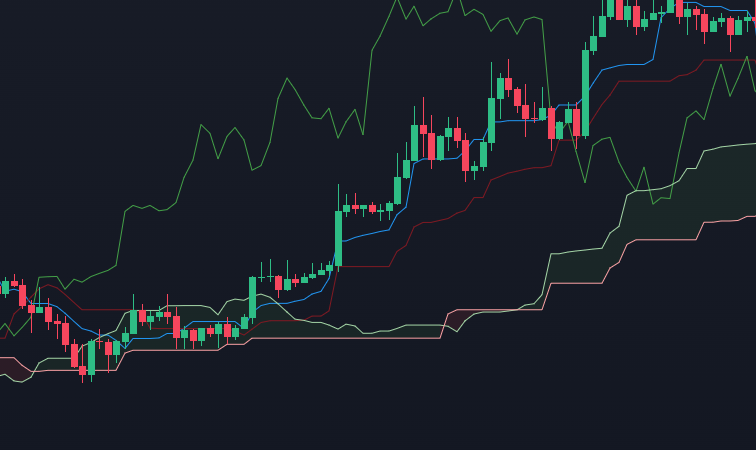
A Moving Average (MA) is a technical indicator that smooths out price data by creating a constantly updated average price, helping to identify the direction of the trend.
Introduction
The Moving Average (MA) is one of the most widely used technical indicators in financial markets. It is used to smooth out price data to create a clearer view of the trend direction over a specific period. By averaging price data, it filters out the noise from random price fluctuations and highlights the underlying trend.
Overview
There are several types of moving averages, each with its own method of calculation and interpretation. The most commonly used types are the Simple Moving Average (SMA), the Exponential Moving Average (EMA), and the Weighted Moving Average (WMA). Each type places a different emphasis on the most recent prices, affecting the indicator’s sensitivity to market movements.
Detailed Description
The Moving Average is a versatile tool used by traders to identify the direction of the trend and potential reversal points. The main types include:
Simple Moving Average (SMA): This is the most basic form of moving average. It is calculated by taking the average of a specific number of past prices. The SMA gives equal weight to all prices in the calculation period.
Exponential Moving Average (EMA): Unlike the SMA, the EMA places more weight on recent prices, making it more responsive to new information. This feature makes the EMA more suitable for short-term trading strategies.
Weighted Moving Average (WMA): The WMA assigns a specific weight to each price point within the chosen period. The most recent prices are given more importance, similar to the EMA, but the WMA can vary in the specific weighting scheme.
Calculation
Simple Moving Average (SMA)
Where represents the closing price and is the number of periods.
Exponential Moving Average (EMA)
The Smoothing Factor is calculated as:
Weighted Moving Average (WMA)
Where represents the closing price and is the number of periods.
Settings
Period Length:
The length of time over which the average is calculated. Common periods include 10, 20, 50, 100, and 200 days. Shorter periods make the moving average more sensitive to price changes, while longer periods smooth out the price fluctuations more effectively.
Type of MA:
Simple (SMA): Less sensitive to recent price changes, suitable for long-term analysis.
Exponential (EMA): More sensitive to recent price changes, suitable for short-term trading.
Weighted (WMA): Similar to EMA but with a different weighting method.
Interpretation
Trend Identification:
A rising MA suggests an uptrend, while a falling MA indicates a downtrend. When prices are above the MA, it can signal a bullish market, and when below, a bearish market.Support and Resistance:
MAs can act as dynamic support or resistance levels. Prices often bounce off these levels, providing trading opportunities.Crossover Signals:
When a short-term MA crosses above a long-term MA, it can signal a bullish crossover, indicating a potential uptrend. Conversely, a short-term MA crossing below a long-term MA can signal a bearish crossover, indicating a potential downtrend.
Example
Consider a stock with the following closing prices over 5 days: $10, $12, $14, $16, and $18. The 5-day Simple Moving Average (SMA) would be calculated as follows:
This 5-day SMA of $14 smooths out the price data and helps identify the underlying trend.
In practice, if the stock’s price is consistently above the 50-day SMA, it suggests a strong uptrend, whereas if it’s below the 50-day SMA, it suggests a downtrend. Traders might look for the price to cross above or below the 50-day SMA as a potential buy or sell signal.
Discover a comprehensive glossary of essential trading terms that every investor should know. Explore detailed explanations of key concepts, from basic definitions to in-depth insights

Delve into detailed explanations of the most important technical indicators used in trading. Designed for traders of all levels, our curated list will help you interpret market signals, make informed decisions, and enhance your trading skills

Access detailed explanations of key chart patterns used in technical analysis. Perfect for traders at any level, our extensive collection will help you recognize market trends, make informed decisions, and refine your trading strategie
Disclaimer
The information provided on this website is for educational and informational purposes only and should not be construed as financial advice. We do not guarantee the accuracy, completeness, or reliability of any information presented. Any actions taken based on the information found on this website are strictly at your own risk. Always seek the advice of a qualified financial professional before making any investment decisions. We disclaim any liability for any losses or damages incurred as a result of using this website.