Ichimoku Cloud
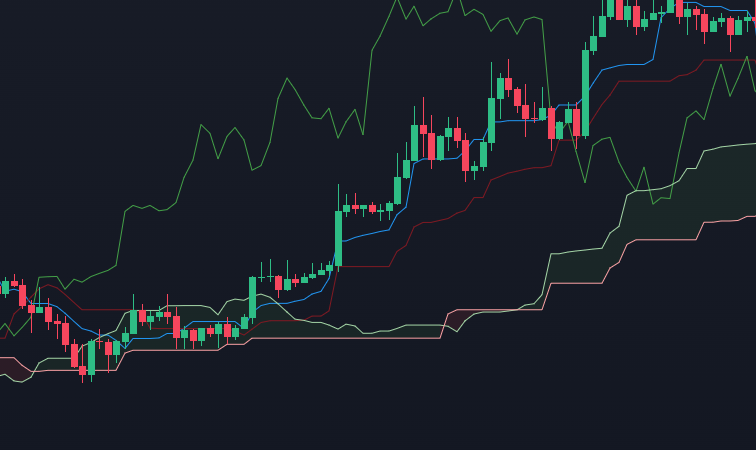
The Ichimoku Cloud, also known as Ichimoku Kinko Hyo, is a comprehensive technical indicator that identifies support and resistance levels, momentum, and trend direction, providing a detailed picture of market conditions.
Introduction
Developed by Japanese journalist Goichi Hosoda in the late 1930s, the Ichimoku Cloud is a versatile indicator that combines several elements to create a visual representation of the overall market trend. It is widely used to identify potential reversals, gauge momentum, and provide a multi-dimensional view of support and resistance. The Ichimoku Cloud is unique in its ability to forecast future price action, making it a powerful tool for both trend-following and reversal strategies.
Overview
The Ichimoku Cloud consists of five main lines, each providing insight into different aspects of the market:
- Tenkan-sen (Conversion Line):
A short-term moving average that shows immediate momentum. - Kijun-sen (Base Line):
A medium-term moving average that provides confirmation of trend direction. - Senkou Span A (Leading Span A):
The midpoint between the Conversion and Base lines, projected 26 periods into the future. - Senkou Span B (Leading Span B):
The midpoint of the highest high and lowest low over the past 52 periods, also projected 26 periods into the future. - Chikou Span (Lagging Span):
The current closing price, plotted 26 periods behind.
Detailed Description
The Ichimoku Cloud is a complex indicator that provides a comprehensive view of the market:
Tenkan-sen (Conversion Line):
This line is calculated as the average of the highest high and lowest low over the past 9 periods. It serves as a measure of short-term momentum and signals potential trend reversals.Kijun-sen (Base Line):
Calculated similarly to the Tenkan-sen but over 26 periods, this line represents the medium-term trend and is often used to confirm signals generated by the Conversion Line.Senkou Span A (Leading Span A):
This is the midpoint between the Tenkan-sen and Kijun-sen, projected 26 periods ahead. It is one of the boundaries of the cloud and plays a crucial role in identifying future support and resistance levels.Senkou Span B (Leading Span B):
This is the average of the highest high and lowest low over the past 52 periods, also projected 26 periods ahead. It forms the other boundary of the cloud.Chikou Span (Lagging Span):
The current closing price, shifted 26 periods back. It provides a visual representation of how current prices relate to past prices.
The Cloud (Kumo) is the space between Senkou Span A and Senkou Span B. When the price is above the cloud, it suggests an uptrend; when it’s below the cloud, it indicates a downtrend. The cloud also serves as a dynamic support/resistance zone. A thin cloud suggests a weak trend, while a thick cloud indicates strong volatility.
Calculation
1. Tenkan-sen (Conversion Line):
2. Kijun-sen (Base Line):
3. Senkou Span A (Leading Span A):
4. Senkou Span B (Leading Span B):
5. Chikou Span (Lagging Span):
Settings
The standard settings for the Ichimoku Cloud are 9, 26, and 52 periods, but traders can adjust these based on market conditions or personal preference. For example, some traders use shorter time frames like 7, 22, and 44 periods for more responsive signals.
Periods (9, 26, 52): These settings reflect short, medium, and long-term trends, respectively. The 9-period Tenkan-sen shows short-term momentum, while the 26-period Kijun-sen reflects the medium-term trend. The 52-period Senkou Span B is used to identify long-term support and resistance.
Cloud Interpretation: A bullish trend is indicated when the price is above the cloud, and a bearish trend is shown when the price is below it. The cloud’s thickness signals the strength of the trend—thicker clouds suggest strong trends, while thinner clouds indicate weaker trends.
Interpretation
The Ichimoku Cloud provides multiple signals to help traders make decisions:
- Trend Direction:
When the price is above the cloud, it indicates a bullish trend. When it is below the cloud, the market is in a bearish trend. Prices inside the cloud suggest a consolidation or sideways market. - Crossover Signals:
A bullish signal occurs when the Tenkan-sen crosses above the Kijun-sen, especially if the price is above the cloud. A bearish signal occurs when the Tenkan-sen crosses below the Kijun-sen, particularly if the price is below the cloud.
Example
Let’s consider a stock that is trending upward, with the following price data over the past 9, 26, and 52 periods:
1. Calculate the Tenkan-sen (Conversion Line):
Assume the highest high over the last 9 periods is 150, and the lowest low is 130.
2. Calculate the Kijun-sen (Base Line):
Assume the highest high over the last 26 periods is 155, and the lowest low is 125.
3. Calculate Senkou Span A (Leading Span A):
4. Calculate Senkou Span B (Leading Span B):
Assume the highest high over the last 52 periods is 160, and the lowest low is 120.
If the current price is 145 and above both the Senkou Span A and Senkou Span B, the market is in a bullish trend. If the Chikou Span is also above the price from 26 periods ago, this further confirms the uptrend.
Discover a comprehensive glossary of essential trading terms that every investor should know. Explore detailed explanations of key concepts, from basic definitions to in-depth insights

Delve into detailed explanations of the most important technical indicators used in trading. Designed for traders of all levels, our curated list will help you interpret market signals, make informed decisions, and enhance your trading skills

Access detailed explanations of key chart patterns used in technical analysis. Perfect for traders at any level, our extensive collection will help you recognize market trends, make informed decisions, and refine your trading strategie
Disclaimer
The information provided on this website is for educational and informational purposes only and should not be construed as financial advice. We do not guarantee the accuracy, completeness, or reliability of any information presented. Any actions taken based on the information found on this website are strictly at your own risk. Always seek the advice of a qualified financial professional before making any investment decisions. We disclaim any liability for any losses or damages incurred as a result of using this website.