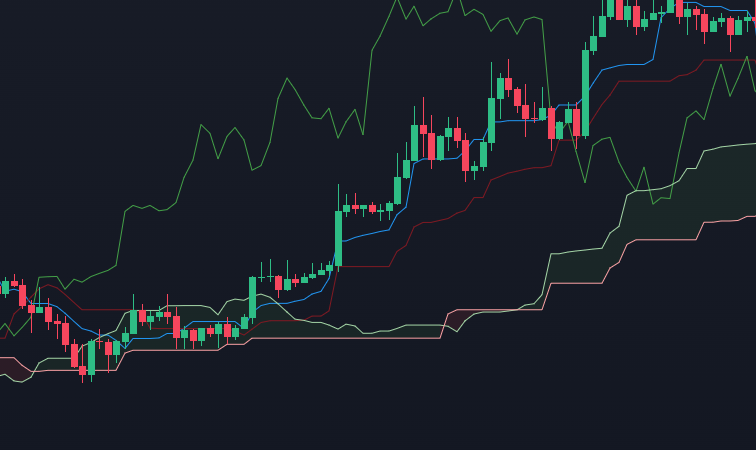
Super Trend
The Super Trend is a trend-following indicator that uses Average True Range (ATR) to help identify the direction of a price trend, with a focus on signaling potential reversals.
Introduction
The Super Trend indicator, widely used in technical analysis, is a trend-following tool that aids in identifying the current price trend and possible reversals. By combining price data with volatility-based adjustments, the Super Trend aims to accurately reflect the overall market direction. The indicator draws a line above or below the price, representing the trend direction: above the price for a downtrend and below the price for an uptrend. This makes it particularly useful for traders who want clear visual signals to confirm trend changes.
The Super Trend is often used in combination with other indicators and works well in trending markets, though it may produce false signals during sideways market conditions.
Overview
The main components of the Super Trend indicator are:
- Average True Range (ATR)
- Trend Line
- Multiplier
Detailed Description
The Super Trend indicator is based on the Average True Range (ATR), a measure of volatility. By incorporating ATR into its calculation, the Super Trend adjusts its position relative to price based on recent volatility levels, thus providing reliable trend signals.
Average True Range (ATR):
The ATR calculates the average volatility over a set number of periods. The Super Trend indicator uses this to account for price fluctuations when setting its trend line.Trend Line:
This line appears above or below the price, depending on the direction of the trend. It changes position when a trend reversal is indicated, moving from above to below the price (or vice versa) to signal a new trend direction.Multiplier:
The multiplier is a value (usually 2 or 3) that determines how far the trend line will be positioned from the current price based on ATR. A higher multiplier results in a wider range between the price and the Super Trend line, producing fewer but potentially more reliable signals, while a lower multiplier creates a tighter range, producing more frequent signals but with higher sensitivity.
Calculation
To calculate the Super Trend, the following steps are used:
1. Calculate the ATR:
2. Determine the Trend Line Position:
- For an uptrend
- For a downtrend:
3. Identify the Trend Direction:
- If the closing price is higher than the current Super Trend level, the indicator signals an uptrend and positions the trend line below the price.
- If the closing price is lower than the current Super Trend level, the indicator signals a downtrend and positions the trend line above the price.
Settings
The Super Trend indicator typically has two main adjustable settings:
- ATR Period:
The default setting is usually 10 or 14 periods. Shorter periods make the indicator more sensitive to price changes, while longer periods smooth out fluctuations. - Multiplier:
Commonly set to 2 or 3. A higher multiplier widens the distance between price and the Super Trend line, which reduces the number of signals but increases reliability. A lower multiplier brings the line closer to the price, which increases sensitivity but may result in more false signals.
Interpretation
Traders interpret the Super Trend indicator in the following ways:
Trend Direction:
- Uptrend: When the Super Trend line is below the price, it signals a potential upward trend.
- Downtrend: When the Super Trend line is above the price, it signals a potential downward trend.
Entry and Exit Signals:
- Buy Signal: When the Super Trend line flips from above to below the price, it indicates a shift to an uptrend and a potential buying opportunity.
- Sell Signal: When the Super Trend line flips from below to above the price, it indicates a shift to a downtrend and a potential selling opportunity.
Combining with Other Indicators: The Super Trend is often used alongside momentum indicators, such as the RSI, to confirm signals. In strong trending markets, the Super Trend’s signals are more reliable, while in choppy or sideways markets, additional confirmation may be needed.
Example
Assume a Super Trend with a 10-period ATR and a multiplier of 2, with the following data:
- Current Period ATR: 1.5
- Latest High: 105
- Latest Low: 100
1. Calculate the Uptrend Line:
2. Calculate the Downtrend Line:
Identify the Trend:
- If the current price closes above 103, the Super Trend will indicate an uptrend, positioning the line at 102.
- If the current price closes below 102, the Super Trend will indicate a downtrend, positioning the line at 103.
By applying these calculations to price action, traders can identify trend reversals and potential trading opportunities.
Discover a comprehensive glossary of essential trading terms that every investor should know. Explore detailed explanations of key concepts, from basic definitions to in-depth insights

Delve into detailed explanations of the most important technical indicators used in trading. Designed for traders of all levels, our curated list will help you interpret market signals, make informed decisions, and enhance your trading skills

Access detailed explanations of key chart patterns used in technical analysis. Perfect for traders at any level, our extensive collection will help you recognize market trends, make informed decisions, and refine your trading strategie
Disclaimer
The information provided on this website is for educational and informational purposes only and should not be construed as financial advice. We do not guarantee the accuracy, completeness, or reliability of any information presented. Any actions taken based on the information found on this website are strictly at your own risk. Always seek the advice of a qualified financial professional before making any investment decisions. We disclaim any liability for any losses or damages incurred as a result of using this website.