Breakout
A breakout occurs when the price of an asset moves above a defined resistance level or below a support level with increased volume, signaling the potential start of a new trend.
Detailed Explanation
In trading, a breakout refers to a price movement beyond a key support or resistance level. This movement is typically accompanied by a surge in trading volume, confirming the strength of the move. Breakouts can indicate the beginning of a new upward or downward trend, depending on the direction.
There are two types of breakouts:
Bullish Breakout:
Price breaks above resistanceBearish Breakout:
Price breaks below support
Breakouts are crucial in technical analysis because they reflect a shift in market sentiment. A successful breakout implies that supply and demand dynamics have changed — buyers overpower sellers in an upward breakout, or sellers overpower buyers in a downward one.
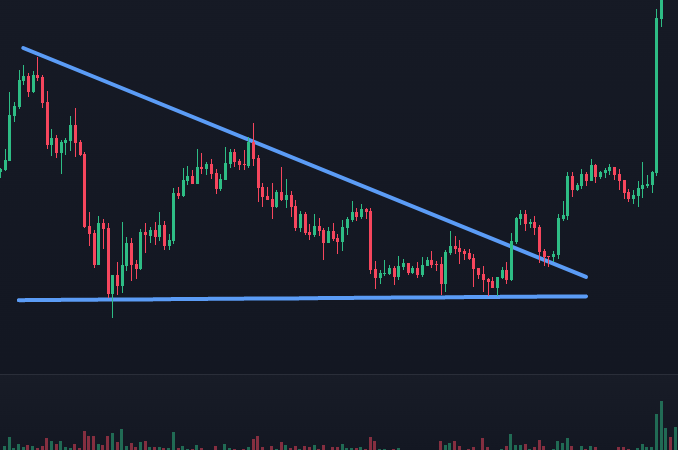
Breakouts often occur from chart patterns such as:
Triangles (ascending, descending, symmetrical)
Rectangles (ranges)
Flags and pennants
Head and shoulders formations
However, not every breakout leads to a sustained move. Sometimes, prices quickly return inside the range. These false breakouts are known as fakeouts and can trap unsuspecting traders.
Volume plays a key role in breakout validation. A breakout with low volume is less likely to result in a sustained trend than one backed by strong participation.
Significance for Investors
Breakouts provide powerful entry signals and help identify early trend development. They are commonly used in momentum and breakout trading strategies.
Traders often place buy orders just above resistance or sell orders just below support, anticipating a strong move after a breakout. Breakouts can also serve as confirmation for trend continuation or reversal.
Recognizing valid breakouts and avoiding fakeouts is critical for reducing risk and improving trade performance. Proper risk management, such as stop-loss placement, is essential when trading breakouts.
Examples
The stock price of Company XYZ has traded between $90 and $100 for several weeks. One day, it breaks above $100 with a significant increase in trading volume. This bullish breakout suggests a potential start of an upward trend, prompting traders to enter long positions.
Comparison with Similar Terms
- Trend Reversal:
A shift in the prevailing trend, often confirmed by a breakout - Support/Resistance:
Key levels that, when broken, trigger breakouts
Discover a comprehensive glossary of essential trading terms that every investor should know. Explore detailed explanations of key concepts, from basic definitions to in-depth insights
Delve into detailed explanations of the most important technical indicators used in trading. Designed for traders of all levels, our curated list will help you interpret market signals, make informed decisions, and enhance your trading skills
Access detailed explanations of key chart patterns used in technical analysis. Perfect for traders at any level, our extensive collection will help you recognize market trends, make informed decisions, and refine your trading strategie
Disclaimer
The information provided on this website is for educational and informational purposes only and should not be construed as financial advice. We do not guarantee the accuracy, completeness, or reliability of any information presented. Any actions taken based on the information found on this website are strictly at your own risk. Always seek the advice of a qualified financial professional before making any investment decisions. We disclaim any liability for any losses or damages incurred as a result of using this website.