Sideways Trend
A sideways trend occurs when the price of an asset moves within a horizontal range, showing no clear upward or downward direction over a period of time.
Detailed Explanation
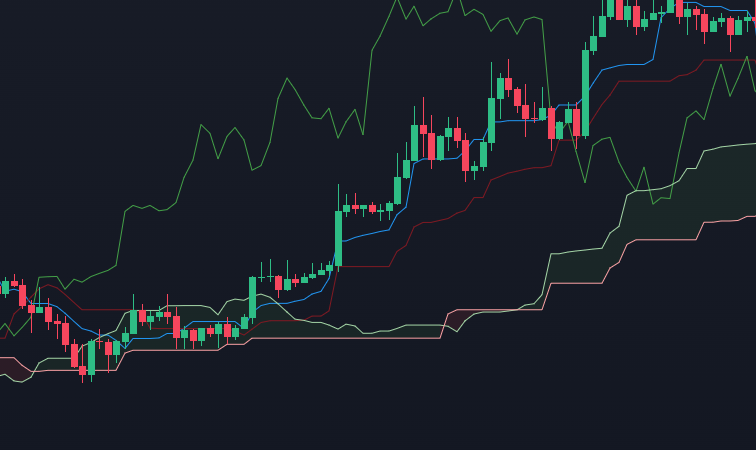
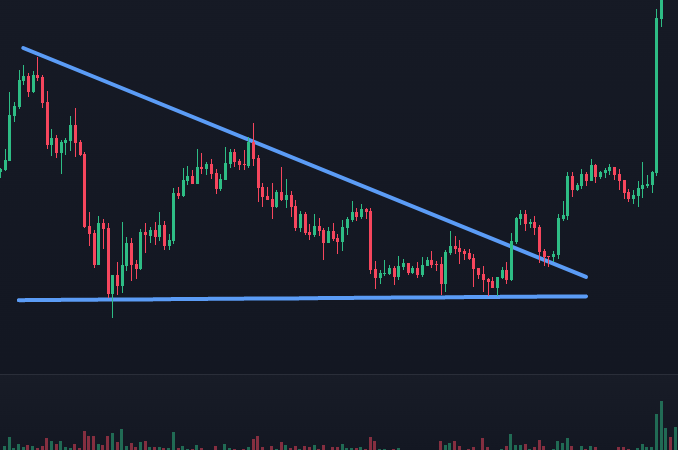
A sideways trend — also known as a horizontal trend or range-bound market — describes a period in which the price of a financial instrument fluctuates within a narrow range, typically between a defined support and resistance level.
During a sideways trend, there is a relative balance between buying and selling pressure. Neither bulls (buyers) nor bears (sellers) dominate the market. As a result, price movements remain confined, often forming a flat or choppy chart pattern with limited directional momentum.
Sideways trends can occur:
After a strong move up or down (as consolidation)
During periods of low market volatility
In uncertain or low-news environments
These trends may last from a few days to several months, depending on market conditions. They often precede a breakout when new information or market momentum pushes price out of the range.
Technical traders often use strategies like range trading within sideways markets. They buy at support and sell at resistance, while keeping a close eye on potential breakout signals.
Significance for Investors
Understanding sideways trends helps investors avoid entering trades with low profit potential or unclear direction. Instead, they can choose to either stay out of the market or apply specific range trading strategies.
For longer-term investors, a sideways trend may signal a period of consolidation before the next major move. It can also be a time to accumulate positions gradually, especially in fundamentally strong assets.
Recognizing sideways markets is also crucial to avoiding whipsaw trades that occur when prices oscillate erratically with no sustained trend.
Examples
The stock of Company XYZ trades between $50 and $55 for over six weeks without breaking out of this range. No major news influences price action, and volume remains low. Traders identify this as a sideways trend and adopt range-trading strategies, buying near $50 and selling near $55.
Comparison with Similar Terms
Uptrend:
A series of higher highs and higher lowsDowntrend:
A series of lower highs and lower lows
Discover a comprehensive glossary of essential trading terms that every investor should know. Explore detailed explanations of key concepts, from basic definitions to in-depth insights
Delve into detailed explanations of the most important technical indicators used in trading. Designed for traders of all levels, our curated list will help you interpret market signals, make informed decisions, and enhance your trading skills
Access detailed explanations of key chart patterns used in technical analysis. Perfect for traders at any level, our extensive collection will help you recognize market trends, make informed decisions, and refine your trading strategie
Disclaimer
The information provided on this website is for educational and informational purposes only and should not be construed as financial advice. We do not guarantee the accuracy, completeness, or reliability of any information presented. Any actions taken based on the information found on this website are strictly at your own risk. Always seek the advice of a qualified financial professional before making any investment decisions. We disclaim any liability for any losses or damages incurred as a result of using this website.